Information Design: Exercises

Angelina Lee An Qi (0334272)
Information Design
Exercises
Lecture Notes
Week 1:
60% Continuous - 20% Exercises + 40% Projects40% Summative - 30% Final Project + 10% E-portfolio
- Know your demographic
- Manage time
Manuel Lima's 9 Directives Manifesto -
1. Form Follows Function
2. Interactivity is Key
3. Cite Your Source
4. The Power of Narrative
5. Don't Glorify Aesthetics
6. Look for Relevancy
7. Embrace Time
8. Aspire for Knowledge
9. Avoid Gratuitous Visualizations
FLIP presentation max 8 min
Final project animated infographic
Week 2:
Saul Wurman's L.A.T.C.H. Application:L- location
A- alphabet
T- time
C- category
H-hierarchy
Definitions:
Location - compare information coming from various sources i.e. atlas, travel guide, parts of body, parts of system
Alphabet - used for very large bodies of information. Not always the best organization method (forced rather than natural) i.e. dictionary, list of states
Time - used for events that occur over a fixed duration. Easy to understand, easy to draw comparisons and conclusions, i.e. a joke, a scenario, a narrative
Category(what I researched for the presentation) - well-inforced by color and placement. Grouped by similar importance--a value judgement i.e. organization of goods, types of activities, breeds of animals
"Category" according to medium.com:
- by far most frequently used technique of organizing content
- refers to any meaningful group, with reference to the website or the audience
- important to define categories which make sense to your users
"Category: according to upwork.com:
- when information needs to be sorted by similarity or relatedness, using category is the best way to organize
- this method of organization is used across physical and digital world
- helps to break down large chunks of information into smaller chunks of information
- easier for users to find a general type of information as long as they know what they are looking for
- works well with organizing items of similar importance
Hierarchy - Assign value or weight to the information usually on a scale i.e. largest to smallest, $$$$ to $
Instructions
Exercise 1
For exercise 1, we were to separate and categorize Lego bricks or buttons. I chose Lego bricks. This exercise is to help us get used to organizing and rearranging data.
 |
| Fig. 1.1 A draft of how I want to categorize the Lego bricks |
 |
| Fig. 1.2 First try of categorizing the bricks. |
 |
| Fig. 1.3 |
 |
| Fig. 1.4 Side view |
 |
| Fig. 1.5 Planning of icons and how I want the amount to be represented |
Final
 |
| Fig. 1.6 |
Exercise 2
For exercise 2, we were to select four Pokemon of different types and create an infographic poster applying the LATCH elements. For mine, I planned to have location (show where the Pokemon are found on the map), category (show which were the starter Pokemon and which were not), as well as hierarchy (through displaying the evolution of each Pokemon). I selected four Pokemon: three which are starter Pokemon (Turtwig, Piplup, and Chimchar) and one which is not (Porygon). |
| Fig. 2.1 Turtwig information |
 |
| Fig. 2.2 Chimchar and Piplup information |
 |
| Fig. 2.3 Porygon information |
 |
| Fig. 2.4 Turtwig sketch |
 |
| Fig. 2.5 Map of the location where my selected Pokemon would be found |
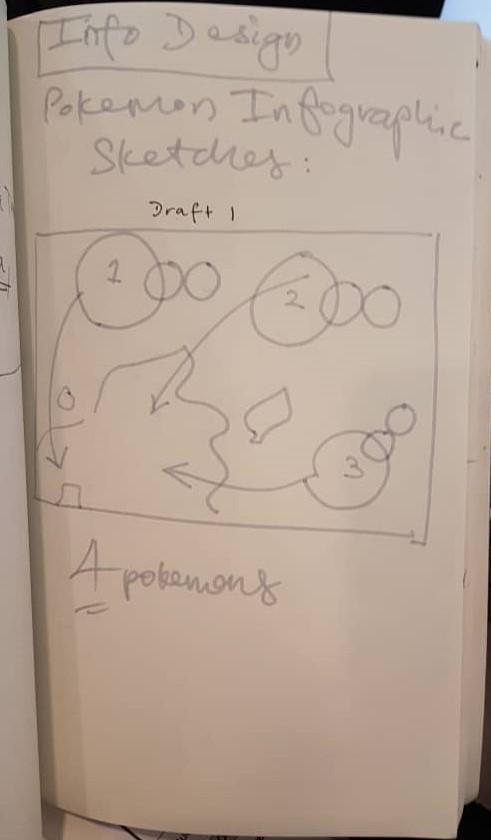 |
| Fig. 2.6 Draft 1 |
 |
| Fig. 2.7 Draft 2 |
 |
| Fig. 2.8 Draft 3 |
 |
| Fig. 2.9 Draft 4 |
 |
| Fig. 2.10 Using the official map for reference |
 |
| Fig. 2.11 Sketching out the placement based on Draft 4 |
 |
| Fig. 2.12 Retracing and recoloring each Pokemon so that it would fit the color scheme |
 |
| Fig. 2.13 Adjusting the placements |
 |
| Fig. 2.14 Adding statistics of each Pokemon |
Final:
 |
| Fig. 3.1 Final outcome |
Feedback
Ms Anis suggested that for exercise 1 I could draw icons next to the amount of Lego bricks per category to identify what each brick looks like.
Reflections
For exercise 1, I had to think a lot about how I wanted to categorize the Lego bricks. I tried separating them by color at first. I soon figured out that I had to divide them into a lot more categories than anticipated.
By the time I worked on exercise 2, I had some understanding of how to divide information into pieces that are easy to the eye and readable.


Comments
Post a Comment